WWW.Cell Biology Education
Each quarter, Cell Biology Education calls attention to several Web sites of educational interest to the life science community. The journal does not endorse or guarantee the accuracy of the information at any of the listed sites. If you want to comment on the selections or suggest future inclusions, please send a message to E-mail: [email protected]. The sites listed below were last accessed on August 25, 2004.
Web learning resources for this issue focuses on chromosomes. The topic was chosen in remembrance of Professor Hewson Hoyt Swift, who passed away January 1, 2004, at the age of 83. Dr. Swift was one of the founders of the American Society of Cell Biology (ASCB). A brief accounting of Swift's life can be found at http://www.ascb.org/profiles/9303.html or at http://www-news.uchicago.edu/releases/04/040122.swift.shtml. As a graduate student in the late 1960s, I always made a point to attend Swift's presentations at the annual ASCB meetings, for it was the best way to keep up with developments in chromosome structure and packing.
INTRODUCTION
During the period 1870–90, persons such as Edouard Balbiani, Walther Flemming, Edouard van Beneden, and Theodor Boveri were describing cell division and cell fertilization for the first time. However, no single term was used for the elements that were dividing and fusing. Heinrich Wilhelm Gottfried Waldeyer gave the chromosome its name in 1888. The name loosely translates to “staining body.”
The visualization of the chromosome is heavily dependent on how the structure is prepared for microscopy. Acid or basic and hypertonic or hypotonic preparation solutions can have a profound effect on the appearance of the chromosome. The difference in T.S. Painter's (1923) original reported human chromosome count of 48 to that of Tjio and Levan's (1956) count of 46 was attributed, in part, to preparation technique. For a history of the determination of the human chromosome number, please visit the Web site listed below for Bioscene, volume 22 (August 1996), and locate issue 2, page 3.
http://papa.indstate.edu/amcbt/volume_22/
Figure 1. A human chromosome smear stained to show the G-bands. The University of Washington Medical School, Department of Pathology Web site (see text) describes the figure as follows: “These G-bands are most commonly used. They take their name from the Giemsa dye, but can be produced with other dyes. In G-bands, the dark regions tend to be heterochromatic, late-replicating, and AT rich. The bright regions tend to be euchromatic, early-replicating, and GC rich.” Used with permission from the Cytogenetics Gallery, University of Washington.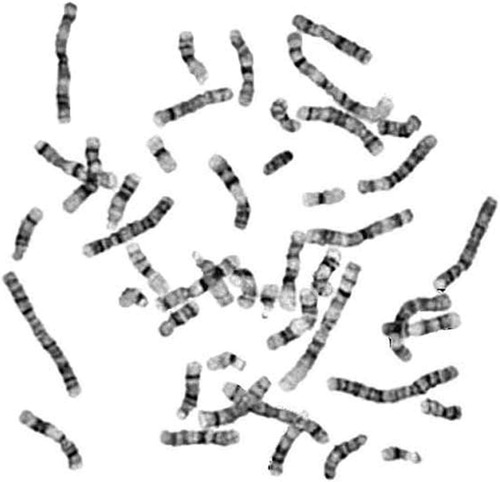
CHROMOSOME PREPARATION
A variety of chromosome preparations are available today compared with the past. A good place to find current protocols for the classroom is Protocol Online.
http://www.protocol-online.org/prot/Cell_Biology/Chromosome/index.html
This site was created in 1999 and is maintained by Longcheng Li of the University of California, San Francisco. Hundreds of different preparation protocols are organized and listed here. The chromosome section contains 29 protocols for the preparation and analysis of chromosomes and their parts. Chromosome preparation protocols were contributed from several sources, including the labs of Thomas Reid of the National Cancer Institute and Tim Mitchison of Harvard University. Also included are five undergraduate lab-based protocols from William Heidcamp of Gustavus Adolphus College in Minnesota. These protocols were excerpted from Heidcamp's well-regarded Cell Biology Lab Manual. One of the Heidcamp protocols is the fast preparation of chromosome smears from Drosophila salivary glands. Another is in a section called “Karyotype Analysis.” In this protocol, different types of chromosome banding are discussed: A, G, R, and C. Different combinations of enzymes and stains can reveal specific parts or bands of chromosomes. The tested Heidcamp chromosome protocols are designed to support activities in an undergraduate cell biology class. Other protocols in Protocol Online give one an overview of the many sources of cells that can be processed in a number of ways to reveal chromosomes and their parts.
Figure 2. A human karyotype. The University of Washington Medical School, Department of Pathology Web site (see text) defines a karyotype as “A systemized array of the chromosomes of a single cell prepared either by drawing or by photography, with the extension in meaning that the chromosomes of a single cell can typify the chromosomes of an individual or even a species.” Used with permission from the Cytogenetics Gallery, University of Washington.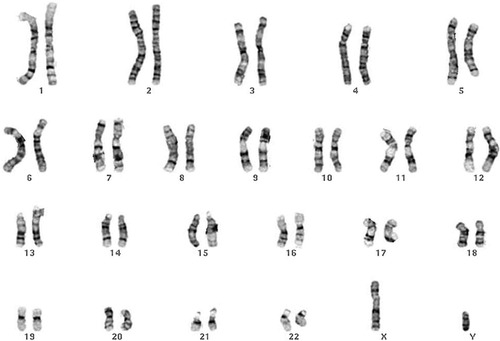
CHROMOSOME BANDING, CHROMOSOME PAINTING, AND FISH
The goal of cytogeneticists for some time has been the automatic recognition of chromosome spreads. Going from a chromosome spread to a karyotype and finally an idiogram takes a great deal of time. Computer software and chromosome staining has reached the point at which machine recognition of chromosomes and differences from the norm is now possible. A good place to put this effort into perspective is to begin with a table of karyotypes and spreads at an excellent Web site of the University of Washington Medical School, Department of Pathology.
Figure 3. A human idiogram, defined by the University of Washington Medical School, Department of Pathology Web site as “The diagrammatic representation of a karyotype, which may be based on measurements of the chromosomes.” One will also find the spelling “ideogram” for the same concept. Both spellings are found with equal frequency in the National Library of Medicine's PubMed database. Used with permission from the Cytogenetics Gallery, University of Washington.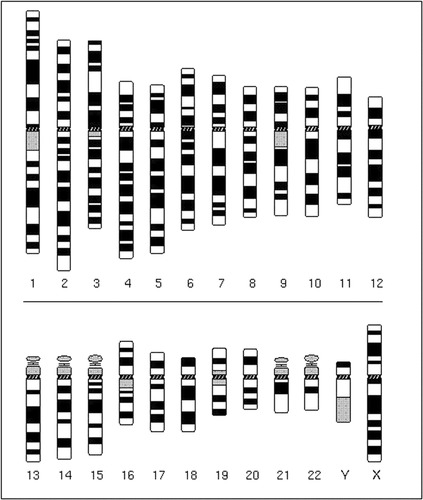
http://www.pathology.washington.edu/galleries/Cytogallery/main.php?file=human%20karyotypes
Figures 1, 2, 3, provided by David Adler, demonstrate the transition between spread, karyotype, and idiogram with human chromosomes. The chromosomes seen here are of the G banding type. Explanations and illustrations of chromosomal abnormalities are provided. Fluorescence in situ hybridization (FISH) is also explained.
The FISH technique has provided many new approaches to identifying and understanding how chromosomes work. Hosted by the University of Bari, Italy, the Web site below provides a good overview of the technique of multicolor FISH used for karyotyping. The technique described is referred to as“ Chromosomal Bar Coding” (Figure 4).
http://www.biologia.uniba.it/eca/NEWSLETTER/NS-9/02-Wienberg.html
PLANT CHROMOSOMES
The site listed below offers an excellent tour through the world of plant chromosomes. The site is maintained by the Federal Centre for Breeding Research on Cultivated Plants (BAZ) in Germany.
http://www.bafz.de/baz99_e/baz_orte/qlb/igk/cytogenetics.htm
Information in terms of handling plant chromosomes is covered in four sections at this site. The first deals with preparation and homogeneous staining, the second provides descriptions of staining for specific band markers, the third section gives examples of FISH procedures for single genes, and the last section describes quantitative image analysis of chromosome-specific features. Figure 5 is representative of imaging of single plant genes and their quantitative analysis.
Figure 4. (A) The figure legend provided by Dr. Wienberg states: “Chromosome bar code for the simultaneous differentiation of all human chromosomes. The probe set is composed of gibbon chromosome-specific paints (left image) and“ fragmented hybrids” (middle image), labeled with five fluorochromes and visualized with M-FISH technology. The right image shows the same metaphase after color classification by Leica MCK software.” (B) Described by Wienberg as an “Enlarged display of human chromosome 1: grayscale images of all 6 image planes, both RGB displays and classification colors (left to right).” Image used with permission from Johannes Wienberg, Institute of Anthropology and Human Genetics, Ludwig-Maximilians-University, Munich, Germany.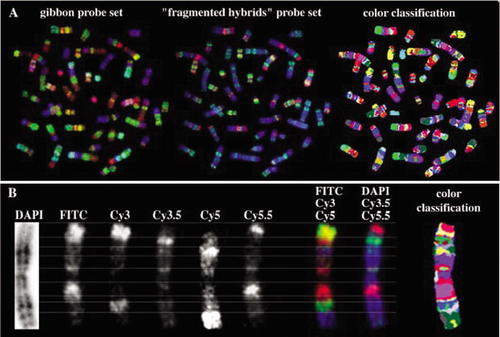
THE DEPARTMENT OF ENERGY AND CHROMOSOMES
The U.S. Department of Energy (DOE) is a major research provider for the human genome project. The DOE has developed a wide variety of Web resources to support both the research and educational aspects of the human genome project. One can gather an overview of these resources at the Web site listed below.
Figure 5. Dr. Schader's description of the images is as follows: “Multiple FISH in an onion-leek hybrid (cf. link Allium) with 3 DNA probes which detect the following genes or sequences: 1. 5S rDNA genes — yellow signals within the chromosomes, 2. Telomeric DNA, specific for the onion chromosomes — yellow signals on the ends of yellow/green stained chromosomes, 3. 25S rDNA genes — red signals. GISH of all 8 onion chromosomes — yellow stained. Two leek chromosomes (6A and 8A) were deleted in this hybrid. The scale bar corresponds to 10 lm.” Used with permission of Dr. Otto Schader of the BAZ.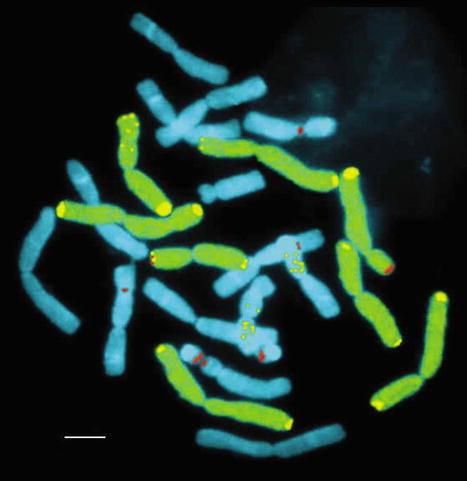
From the site above one can advance to the site below.
http://www.ornl.gov/sci/techresources/Human_Genome/home.shtml
Several pages branch from this page to extremely rich teaching and learning sources. One of these is the Gene Gateway.
http://www.ornl.gov/sci/techresources/Human_Genome/posters/chromosome/
The Gene Gateway describes itself in the following terms:
Scientists, enabled by the Human Genome Project, are churning out an unprecedented volume of data on human chromosomes and the tens of thousands of genes residing on them, many associated with genetic disorders. These data, and many Web sites on human genetic disorders, are freely accessible on the Internet. Gene Gateway, originally designed as a Web companion to the popular Human Genome Landmarks poster, is a collection of guides and tutorials designed to help students and other novice users get started with some of the resources that make these data available to the public.
Figure 6. A screen-grab from the first page of a 52-page workbook that outlines five teaching exercises. Used with permission of the U.S. Department of Energy through their representative Jennifer Bownas.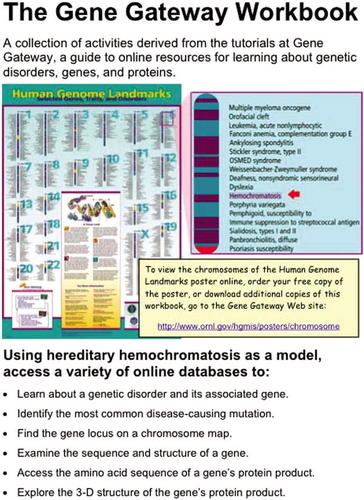
From this page, one can download two very useful PDF files, which are described as follows:
Download the Gene Gateway Workbook (PDF), a collection of five activities with screenshots and step-by-step instructions designed to introduce new users to genetic disorder and bioinformatics resources on the Web. Download the Gene Gateway Handout (PDF), a 2-page flyer describing this Web site.
These two files open the way to a rich source of teaching and learning information. (PDF stands for portable document format from Adobe Systems and the reader for the PDF files is available at no charge from http://www.adobe.com/products/acrobat/readstep2.html.)
Figure 6 is a sample of a workbook that provides five high-impact activities. The workbook uses screen shots on how to use significant bioinformatics tools from the following Web sites: OMIM, Gene Reviews, NCBI Map Viewer, Entrez Gene, Gene Bank, Swiss-Prot, Protein Data Bank, and Protein Explorer. The primer assumes that the reader is a first-time user. It is a really good way to get at this wealth of information.
Figure 7. A composite image drawing information gathered from the site dealing with genetic disorders, in this case, cystic fibrosis. Used with permission of the U.S. Department of Energy through their representative Jennifer Bownas.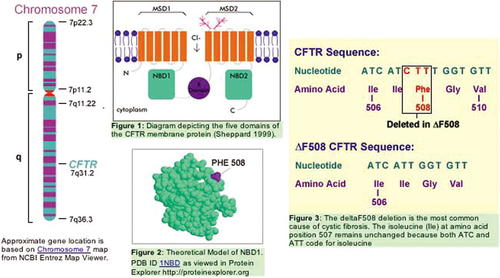
After working with the Gateway Workbook, one should move to the online chromosome selector URL listed below. With the use of a chromosome image metaphor, various genes, traits, and disorders are mapped to the chromosome, and its region is associated with the interesting feature. Details of the chromosome's function are uncovered by mouse clicking on the appropriate part of the chromosome.
http://www.ornl.gov/sci/techresources/Human_Genome/posters/chromosome/chooser.shtml
The information gathered in Figure 7 has a very high teaching and learning value. This kind of genetic disorder information can be reached at the following URL.
http://www.ornl.gov/sci/techresources/Human_Genome/posters/chromosome/cftr.shtml
The DOE site requires a great deal of time to fully appreciate. It is well laid out but dense with information, as was the mind of Dr. Swift. A true giant of cell biology left us with his passing.


