Bringing Climate Change into the Life Science Classroom: Essentials, Impacts on Life, and Addressing Misconceptions
Climate change is at the forefront of our cultural conversation about science, influencing everything from presidential debates to Leonardo DiCaprio’s 2016 Oscar acceptance speech. The topic is becoming increasingly socially and scientifically relevant but is no closer to being resolved.
Most high school students take a life science course but significantly fewer take earth or environmental science. This leaves life science educators with the critical task of conveying information about climate change despite many having never received any formal education on the topic themselves. Earlier this year, Science magazine and the National Center for Science Education published results from the first nationally representative survey on how teachers approach climate change in their classrooms (Plutzer et al., 2016a,b). The researchers found that most middle school science teachers and high school biology teachers allocate at least an hour to discussing recent global warming. However, most of these teachers were not aware of the extent of scientific consensus on the topic—97% of climate scientists agree that climate change is caused by human activity. This gap in knowledge may create a sense of pressure for teachers to provide a “balanced” presentation of the issue, although the evidence suggests that to do so would only serve to perpetuate misconceptions and erode the validity of scientific consensus in the minds of students. Thus, even high-achieving students may arrive at college with gaps in their knowledge that need to be addressed before moving on to study the consequences of climate change within the life sciences.
In this Feature, we highlight free online resources that will be useful for science educators teaching climate change to high school and undergraduate students.
PRIMERS AND REINTRODUCTIONS
For teachers looking for a quick and thorough overview of the most basic and compelling data on climate change, an excellent starting place is the introductory section “Current Climate Change” in the Climate Science Primer available through the U.S. Forest Service Climate Change Resource Center (www.fs.usda.gov/ccrc/climate-basics/climate-primer). The primer is text-based and concise and includes an animation showing the relationship between temperature and atmospheric CO2 from 800,000 yr ago to the present (1:31 min). The site also includes several data-rich graphs: the rise in temperature from 1880 to the present, the correlation between temperature and atmospheric CO2 over the past 450,000 yr, the rise in sea level since 1870, and the decline in Antarctic ice mass.
Subsequent sections of the primer go on to explain the mechanism of global warming—the greenhouse effect, human influence on the greenhouse effect, natural climate cycles, and the effects of climate change on ecosystems in the United States, including modeling predictions of changes in precipitation and temperature. The Climate Change Education portion of the website features two Education Modules (www.fs.usda.gov/ccrc/climate-basics/education;Figure 1). Climate Change Science and Modeling (22:57 min), and Climate Change Effects on Forests and Grasslands (20:32 min). The modules are narrated video interactives that have the option for closed-captioning. Text versions of the narration are also available. Each section of the Climate Change Resource Center is well referenced with peer-reviewed research articles.
Figure 1. The U.S. Forest Service Climate Change Resource Center features two interactive Education Modules. Climate Change Effects on Forests and Grasslands (20:32 min) provides an overview of how those ecosystems are affected by climate change (www.fs.usda.gov/ccrc/climate-basics/education).
The National Aeronautics and Space Administration’s (NASA) Global Climate Change: Vital Signs of the Planet website (http://climate.nasa.gov) provides extensive and stunning graphics and multimedia resources to visualize climate data. Students can access short videos featuring satellite imagery and images from space, infographics on the rise in global temperatures and sea level, and quizzes on the topics covered on the website (http://climate.nasa.gov/resources/graphics-and-multimedia/; Figure 2). The website also offers several mobile apps for Apple devices: Earth Now, which displays real-time global satellite data (also available for Android devices); Images of Change, a collection of photographs and satellite data that show the effects of climate change over time; and Offset, a retro-style educational game about slowing the effects of global warming through the use of alternative energy sources (http://climate.nasa.gov/earth-apps/). While relatively few of the materials explicitly incorporate life science, the visual quality of the materials alone makes the website worth visiting.
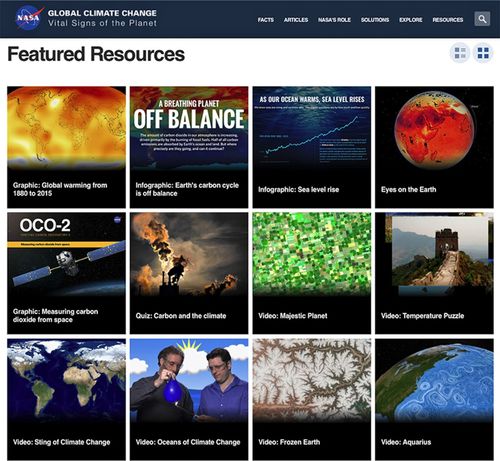
Figure 2. NASA’s Global Climate Change: Vital Signs of the Planet website provides a unique way to view the changes Earth has experienced during recent climate change, exploring greenhouse gases, oceans, and melting ice using images collected by satellite (http://climate.nasa.gov/resources/graphics-and-multimedia/). Sources include NASA, the NASA Goddard Institute for Space Studies, the NASA Jet Propulsion Laboratory, the California Institute of Technology, and the NASA Scientific Visualization Studio.
Climate Literacy: The Essential Principles of Climate Science (2009; 18 pp.) is a text-based interagency guide published by the U.S. Global Change Research Program. This guide provides a framework and seven essential principles for formal and informal education about climate change (http://downloads.globalchange.gov/Literacy/climate_literacy_highres_english.pdf). It is available in English and Spanish. For those seeking further non English language resources, the U.S. Environmental Protection Agency has translated their website, including a section on climate change, into five languages ( www3.epa.gov).
IMPACTS OF CLIMATE CHANGE ON NONHUMAN LIFE
Although a multitude of resources exist on how and why climate change is occurring, there are relatively few resources that provide details about the impacts of climate change on plants and animals. Ecological Impacts of Climate Change (2009; 32 pp.) from the National Academies presents examples of impacts on specific plant and animal species in each of seven regions of the United States—the Pacific coastline, Alaska and the Arctic, the western mountains, the southwestern deserts, and the central, southeast, and northeast regions. The booklet is abundantly illustrated with photographs and other visuals and would be appropriate to assign as an introductory, out-of-class reading on climate change and ecology. It is freely available as a downloadable PDF at http://oceanservice.noaa.gov/education/pd/climate/teachingclimate/ecological_impacts_of_climate_change.pdf.
The Quest website from KQED Science provides several resources that can be found in the Topics (Climate) and Collections (Ocean Acidification) drop-down menus under the website title ( ww2.kqed.org/quest). For example, the Giant Sequoias Struggle with Drought movie (6:58 min; ww2.kqed.org/quest/2015/11/17/giant-sequoias-struggle-with-drought/) presents the effects of the warming climate and associated drought on tree species, including sequoias. Researchers show how they collect samples from the canopies of these ancient, tall trees and use a pressure chamber to measure the trees’ levels of water stress. An animation that shows how water stress can lead to tree death also makes this movie appropriate for plant anatomy or physiology classes. Napa Wineries Face Global Warming (7:20 min; ww2.kqed.org/quest/2015/01/06/napa-wineries-face-global-warming/) describes how temperature changes will lead to unpredictable changes in the areas of the United States that are appropriate for growing particular varieties of grapes. The section discussing the impact of temperature on sugar and anthocyanin production in grapes, and thus wine, makes this movie particularly appropriate for plant biology or economic botany classes. Balancing Act: Otters, Urchins and Kelp (7:19 min; ww2.kqed.org/quest/2014/02/25/balancing-act-otters-urchins-and-kelp/) illustrates the complexity of natural ecosystems and their impact on CO2 levels. The reintroduction of sea otters on the west coast of Washington led to a reduction in sea urchins (which the otters eat) and an increase in kelp (on which the urchins graze). Kelps are one of the most efficient absorbers of atmospheric CO2; they can absorb up to 12 times more CO2 when sea otters are present. Ocean Acidification and Marine Life ( ww2.kqed.org/quest/2014/12/12/ocean-acidification-and-marine-life) is an animated set of seven slides that provides an introduction to the chemistry of ocean acidification and its effect on shell formation.
A free iBook, Clue into Climate, also from KQED, includes Chapter 3, “Changing Ecosystems,” with several embedded movies. A Warmer World for Arctic Animals (3:02 min) describes the impacts of warming temperatures on polar bears, walruses, arctic foxes, and Beluga whales. The California at the Tipping Point: Intertidal Zone excerpt (4:14 min) discusses the impact of warmer ocean temperatures and rising ocean levels on tidal pool ecosystems. Some Bugs Like It Hot (10:12 min) describes how warmer temperatures have led to a large increase in the overwintering range of the potato–tomato psyllid, leading to significant crop damage and decreased income for farmers. Another economic botany movie in Chapter 1, “Causes of Change,” describes the impacts of warmer weather on the cherry crop—Uncool Cherries (6:37 min). All of these movies have high production values and feature scientists at several career stages. The iBook chapters also include simple interactives that address topics related to climate change. Some of the interactives are also available in the “Clue into Climate” collection on the Quest website.
Earth Vision Institute’s Getting the Picture: Our Changing Climate online multimedia tool (http://gettingthepicture.info/;Figure 3) provides an introduction to climate change. Section 4, “Our Changing Biosphere,” includes examples of the effects of climate change on phytoplankton, penguins, polar bears, coral reefs, and Rocky Mountain forests and discusses phenology (the study of cyclical and seasonal natural phenomena) and the impact of changing seasons on pollinators. The text is supported by short movies, animations, enlargeable photos, graphics, and a clickable U.S. map describing the responses of 30 organisms to climate change.
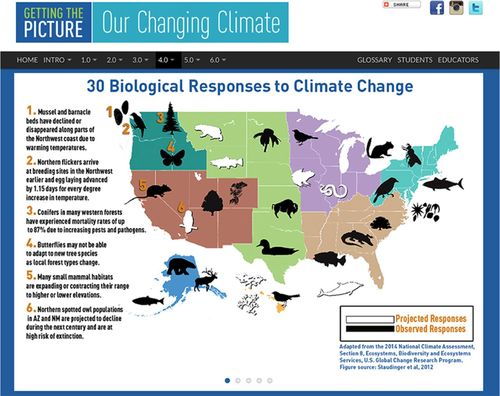
Figure 3. Earth Vision Institute’s Getting the Picture: Our Changing Climate, Part 4: Our Changing Biosphere focuses on the effects of climate change on ecosystems. This section emphasizes the effects on life connected to the oceans and includes an interactive map that describes 30 different ecosystem responses to climate change organized by U.S. region (http://gettingthepicture.info).
The National Park Service (NPS) has produced a series of movies (3:05–8:58 min) on the consequences of climate change for plants and animals in national parks across the United States. Unfortunately, there does not seem to be a single location with links to all of the movies. We found some on the NPS Climate Change website (www.nps.gov/subjects/climatechange/sciencevideos.htm). For example, Ocean Acidification at Point Reyes National Seashore (7:43 min) presents the effects of ocean acidification on multiple organisms in the ecosystem and on food webs. It features primarily women scientists, who provide background information and discuss several research studies. Species Range Shifts at Sequoia-Kings Canyon National Park (8:30 min) is unusual in that it raises questions about the choices we will have to make about species preservation as the climate changes. We found movies from additional parks by searching “climate change” on the NPS website (www.nps.gov). The NPS movies provide local information for those in the vicinity of these parks.
DATABASES OF SEARCHABLE RESOURCES
Several websites curate lists of hundreds or thousands of multimedia resources that can be searched using multiple filters, including intended audience, resource type, and scientific subheadings. Though these websites will likely deliver overlapping results, the different foci of the parent organizations and searchable filters allow educators to discover resources that can be more exactly matched to fit their curricular needs. While all of these resources are relevant for teaching climate change, a minority of them have an explicit focus on life science. Most of them focus on CO2 concentrations, global temperature models, or sea-level rise.
The Collection of Climate and Energy Educational Resources Portal (CLEAN; http://cleanet.org) is one of the most extensive collections and lists 655 resources that are sorted as activities, short demonstrations/experiments, visualizations, or videos. These resources are continually updated by qualified scientists and educators from institutions that include the National Oceanic and Atmospheric Administration, the Science Education Resource Center at Carleton College (SERC), the Cooperative Institute for Research in Environmental Sciences, and TERC (Technical Education Research Centers). These professionals engage in a rigorous review process, examining each resource for its accuracy and alignment with Climate Literacy and Energy Literacy frameworks and the Next Generation Science Standards.
The CLEAN visual resources range in complexity. For example, visitors can find single static images, including a map of the global Climate Demography Vulnerability Index showing human populations with the highest vulnerability to climate change (www.mcgill.ca/files/_nea/172326_GlobalVulnerabilitymap.pdf).
An extensive, interactive website, Global Forest Watch, hosts a forest-monitoring tool that permits users to make country-by-country or global comparisons of tree-cover loss and other ecological or geopolitical information (www.globalforestwatch.org/map/; Figure 4). Beyond presenting complicated data in several interactive formats, Global Forest Watch is notable in that its interactive map and supporting blogs can be viewed in 15 different languages.
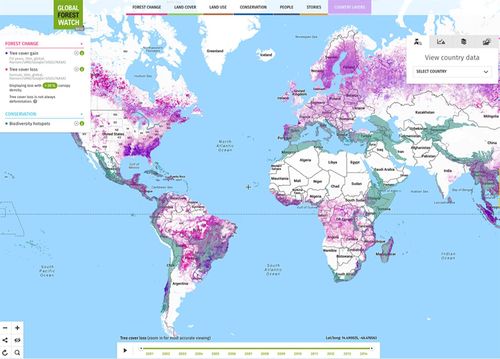
Figure 4. Global Forest Watch hosts an interactive map that allows users to visualize Earth in terms of forest change, land cover, land use, conservation information such as biodiversity hot spots, and demographic information, including country borders and population density. An additional sliding bar makes it possible to layer these different types of information over various increments in time, with data spanning the years 2001–2014 (www.globalforestwatch.org/map).
The CLEAN Collection overlaps with the 3548 resources listed at SERC when searching for “climate change” (http://serc.carleton.edu/serc/search.html). In addition to its searchable database, SERC also has a site guide specific for climate change and global warming (http://serc.carleton.edu/serc/site_guides/climate.html), which allows users to browse 707 climate change activities and 262 climate change courses (65 and 17 of which are cross-listed with biology in their search engine, respectively). Many of these resources are text-based classroom activities or syllabi. For example, the “Malaria and Global Warming” exercise was developed for an introductory college-level biology course by Dale Blum at Pierce College (http://serc.carleton.edu/bioregion/examples/59109.html). In it, students are asked to work in small groups and map where they predict malaria will be found in the next 50 yr based on information about factors that affect the distribution of malaria in North and South America.
National Geographic published a special issue on climate change and offers 75 teacher resources appropriate for high school or postsecondary students (http://education.nationalgeographic.org/topics/climate-change/). Like the previous databases, these resources can be sorted by audience and format. An example of a relevant high school activity designed to take 45 min is “Sources, Sinks, and Feedbacks: What Role do the Oceans Play in Global Warming?” (http://education.nationalgeographic.org/activity/sources-sinks-and-feedbacks/). This activity lets students explore the relationships between ocean surface temperature and levels of atmospheric CO2 and water vapor.
The National Science Digital Library connects to 1978 educational resources on climate change ( https://nsdl.oercommons.org/search?f.search=climate+change); of these, 700 are listed as being appropriate for high school or college audiences and are cross-listed with the subject area “life science.” In addition to being able to search by subject area, education level, and material type, users can refine their searches by including education standards; results can be sorted by title, relevance, rating, or date. A quick search turned up “AH-CHOO! A Case Study on Climate Change and Allergies” (http://nsdl.oercommons.org/courses/ah-choo-a-case-study-on-climate-change-and-allergies/view), which is hosted by the National Center for Case Study Teaching in Science. In this text-based activity, students engage in scientific argumentation by role-playing a public relations specialist to evaluate data and develop materials to communicate the link between climate change and pollen allergies.
ADDRESSING MISCONCEPTIONS AND CLIMATE CHANGE DENIAL
Perhaps the most fundamental barrier to teaching and communicating about climate change is the fact that some people treat the topic as controversial despite a clear consensus in the scientific community about its causes and effects. As such, educators may find it helpful to introduce the topic by first addressing misconceptions and deliberate misinformation perpetrated about climate change. This approach is not without its hazards, as detailed in The Debunking Handbook, a nine-page document that is one of many clear and well-referenced resources available through the website Skeptical Science (www.skepticalscience.com/Debunking-Handbook-now-freely-available-download.html).
A common approach to dispelling misconceptions rests on the assumption that they exist due to a lack of knowledge and that simply supplying more information will displace the misinformation. This communication strategy, known as the information deficit model, tends to fail when directed at deeply entrenched ideas, however tenuously supported by evidence or wishful thinking. Several “backfire effects” have been identified in communication research. These show that attempts to refute misinformation can actually strengthen people’s incorrectly held beliefs by increasing their familiarity with the myths themselves, by providing too many counterarguments that make the original myth attractive in its relative simplicity, or by attempting to dispel myths that are tied to a cultural identity or worldview that is linked to a person’s sense of self.
Skeptical Science (www.skepticalscience.com) provides summaries of current peer-reviewed climate science organized around the claims most frequently made by climate change “skeptics.” The website’s user interface is a bit cluttered but includes resources that have been translated into more than a dozen languages. The information is updated frequently with original material and cross-posts from other websites, including text, videos, and graphical representations of data, that deal with either climate science or climate science politics. The website also offers free smartphone apps for Apple, Android, or Nokia devices that allow users to view the most commonly used skeptic arguments coupled with summaries and links to the original scientific research that refutes each argument (Figure 5). Skeptical Science also has made freely available their self-paced Massive Open Online Course (MOOC) on Denial101x: Making Sense of Climate Science Denial. The course materials—intended to serve as resources for teachers—contain 81 short lectures, each ~5–7 min long, and 40 full interviews with climate science experts (www.skepticalscience.com/denial101x-videos-and-references.html).
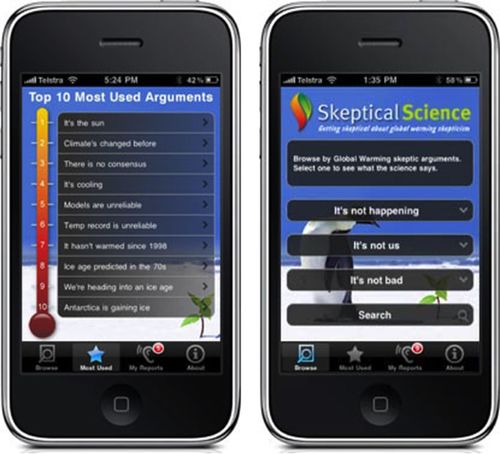
Figure 5. The smartphone apps provided by Skeptical Science allow users to have the most commonly used “skeptic” arguments against climate change at their fingertips. Highlighting individual arguments provides the corresponding data to effectively rebut each skeptical claim.
Two other video-driven websites that offer resources to deal with misconceptions include the science video blog/YouTube channel Veritasium (www.youtube.com/user/1veritasium) and ClimateCrocks.com. Derek Muller from Veritasium has created an entertaining and referenced video on 13 Misconceptions about Global Warming (6:49 min; published on September 22, 2014; www.youtube.com/watch?v=OWXoRSIxyIU). While it is unlikely to be universally appreciated, his irreverent tone may be particularly appealing to high school and college students. His video Climate Change Is Boring (4:55 min; published on August 29, 2014) may also be appropriate as an introductory assignment to show that, while the public might conceptually link climate change with the hole in the ozone level or the individual decision to engage in personal consumer recycling, the main driver of climate change is greenhouse gas emissions (www.youtube.com/watch?v=eNx9tvCrvv8).
“Inoculating” one’s audience by explaining the techniques used to spread climate change misinformation has been shown to strengthen resistance to unscientific claims by bolstering critical-thinking skills. Peter Sinclair’s frequently-updated blog ClimateCrocks.com (http://climatecrocks.com) sets out to accomplish this by responding to media coverage of climate change. The blog spans from July 2009 to the present. Its short video series, Climate Denial Crock of the Week, features excerpts from interviews with climate and policy experts, speaking at a level appropriate for the educated layperson (http://climatecrocks.com/category/crock-of-the-week). Of these, one of the most sobering interviews is with glaciologist Eric Rignot of NASA, who speaks about his research on the melting Antarctic ice sheets (http://climatecrocks.com/2015/01/22/the-fuse-is-blown-glaciologists-jaw-dropping-account-of-a-shattering-moment/; 4:26 min). A second short video on the same page, made in conjunction with Yale Climate Connections, Meltwater Pulse 2B, models the melting of the Antarctic and Greenland ice sheets (5:56 min).
Climate change is arguably the most pressing existential issue for modern human civilization. An understandable response, given the scale of the threat, is to file climate change alongside other doomsday scenarios—like a gigantic meteor colliding with Earth—and hope it will not happen while privately marking it as unlikely. But unlike doomsday scenarios from science fiction, climate change is a challenge firmly grounded in scientific evidence. We can do something about it if we understand the problem clearly. However, more research is needed on methods to successfully overturn people’s misconceptions about climate change: that is, how do we divorce the factual nature of this information from a sense of threatened cultural or political identity.
ACKNOWLEDGMENTS
We thank A. Malcolm Campbell for critical comments and helpful suggestions on this Feature and John Cook for useful discussion about his research on misconceptions.
AUTHORS’ NOTE
The number of results retrieved from querying databases was accurate as of March 2016, when the manuscript was written.
EDITOR’S NOTE
Based on the Plutzer et al. (2016a,b) report showing that many of today’s teachers are not educating America’s children about what is known about climate change, please consider sharing this Feature with friends and family members in educational positions.


